
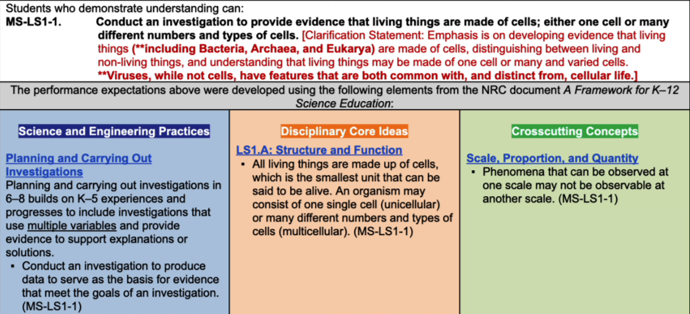
Summative assessments require students to make connections between the DCI (the content knowledge), SEP (skills they’re learning), and Cross-Cutting concepts (lenses they use to look at different problems and phenomena).
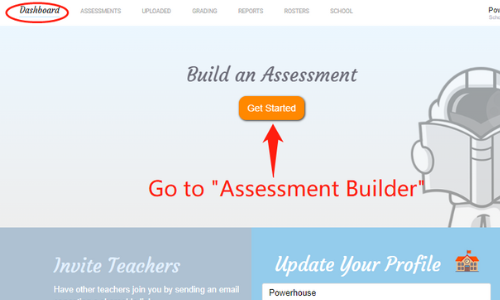
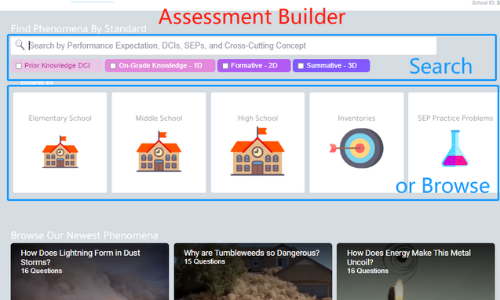
First, let’s navigate to the Builder from the dashboard by clicking “Get Started”.
There are 2 ways to search on innerorbit: the search bar or the browse tiles. If you have a specific standard in mind, use the search bar. First, you’re going to search for the performance expectation you’re looking for, and then, we’ll apply a question filter and we’re going to look for 2D or 3D questions. You can also type in any of the NGSS dimensions, like “DCI “and look through the search results. If you’d rather browse, use the tiles to narrow down your choices.
We label these as formative and summative. In our surveys of statewide tests in the blueprints that they use to build those tests, both two-dimensional and three-dimensional questions are fair game, so we recommend that you use our 2d or 3d questions to meet the level of rigor required of a summative assessment to make sure to tick the boxes.
Let’s try looking for standard MS-LS2-1.
We can either use the search bar or click through the browse tiles (Middle School > Life Science > MS-LS2 Ecosystems > MS-LS2-1).
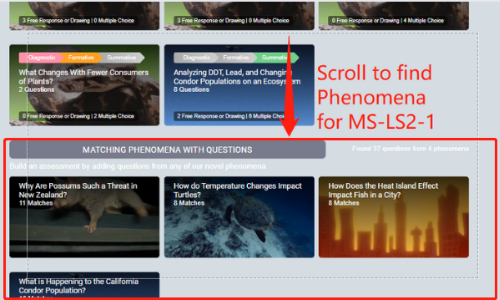
Scroll down to “Matching Phenomena with Questions”. Here you’ll see that there are 4 unique phenomena for this MS-LS2-1 standard.
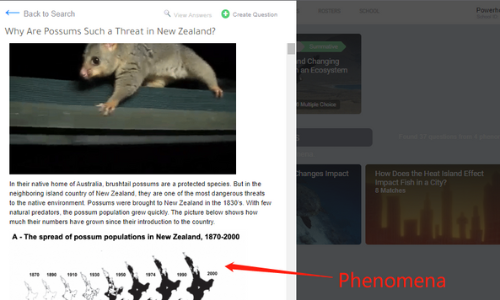
Click on a tile to preview the phenomenon and corresponding questions. Read through the phenomenon, figures, and data.
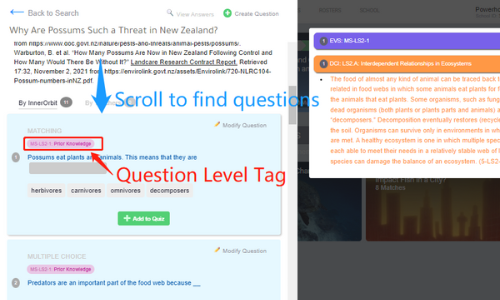
Students need to acclimate themselves to the phenomenon. Read through all the charts and graphs we give them and integrate the phenomena with all of the statements and complexity of the questions being asked. If you choose five questions, you should expect students to take between 20 and 25 minutes for students. If you offer 10 questions you should expect them to spend about 40 to 50 minutes answering them.
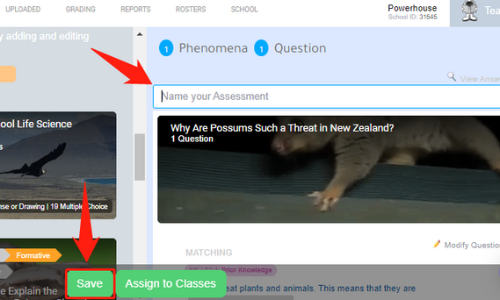
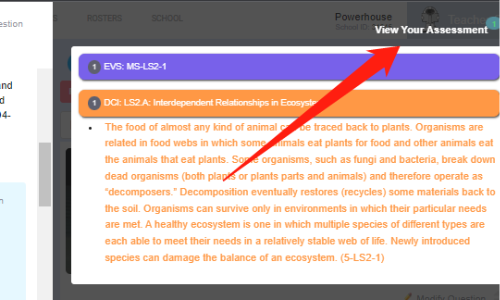
Click “View your Assessment” to see your selections
Create a name for the activity and press Save. You can find this activity in your Assessment Tab under “Created by you”